


Effective November 1, 2026
On November 1, 2026, the United States Sentencing Commission’s adopted inflationary amendments (Amendment 838) to the U.S. Sentencing Guidelines Manual took effect. Marking the first recalibration of federal economic crime monetary thresholds since 2015, these reforms modernize the §2B1.1 Loss Table and 18 cross-referencing Chapter Two guidelines to account for a decade of Consumer Price Index (CPI) inflation.
How to leverage the changes, right now.
Immediate Plea Renegotiation & PSR Recalculation
Under USSG §1B1.11(a), courts apply the Guidelines Manual in effect on the date of sentencing. Defendants who have entered guilty pleas or received Presentence Investigation Reports (PSRs) calculated under the pre-November 1 thresholds—and whose loss amounts fall inside an applicable inflationary “straddle” window—possess immediate grounds to recalculate their Total Offense Level (TOL) downward by 2 levels and renegotiate outdated plea stipulations.
Empirical Data Advocacy
Because a 2-level inflationary drop shifts defendants into lower Total Offense Level cohorts on the Sentencing Table, defense counsel must pair the live November 1 guideline calculation with targeted historical sentencing analytics during the PSR objection and sentencing memorandum stages to establish accurate benchmark cohorts and argue for downward variances under 18 U.S.C. § 3553(a).
Overhauling the Economic Crime Loss Table (§2B1.1)
The primary engine driving sentences in fraud, embezzlement, and theft prosecutions—the §2B1.1(b)(1) Loss Table—was last adjusted for inflation in 2015 (Amendment 791). Under Amendment 838, the Commission applied a Bureau of Labor Statistics CPI multiplier followed by the prescribed rounding approach across all 16 tiers of the loss table:
- 33% to 58% Higher Dollar Cutoffs Across All 16 Tiers: While the Commission retained the 16-tier structure (Tiers A through P in 2-level increments), it raised the dollar threshold required to trigger each offense-level increase by 1.33x to 1.58x.
- Zero Upward Exposure: Under the adopted 2026 loss table, no loss bracket increases a defendant’s loss enhancement. For any given dollar loss, the applicable loss enhancement either remains unchanged or drops by 2 offense levels (which generally corresponds to an approximate 25% reduction in the advisory guideline minimum, holding other factors constant).
Data Baseline Note: All impact percentages reported by the U.S. Sentencing Commission in its 2026 data briefings are derived from Fiscal Year 2024 (FY 2024) federal sentencing data.
The Live 2026 §2B1.1 Loss Table (Prior vs. New Cutoffs)
The table below details the percentage increases corresponding to the Commission’s inflation adjustments, prior 2015 dollar thresholds, and the live November 1, 2026 cutoffs. For enhancement tiers B through P, the dollar interval between each prior threshold and its new cutoff identifies losses for which the applicable enhancement decreases by two levels.
| Tier | Loss threshold shift | Increase | Offense level |
|---|---|---|---|
| (A) | +38% |
No increase | |
| (B) | More than |
+38% |
+2 levels |
| (C) | More than |
+33% |
+4 levels |
| (D) | More than |
+38% |
+6 levels |
| (E) | More than |
+58% ★ |
+8 levels |
| (F) | More than |
+33% |
+10 levels |
| (G) | More than |
+40% |
+12 levels |
| (H) | More than |
+36% |
+14 levels |
| (I) | More than |
+33% |
+16 levels |
| (J) | More than |
+43% |
+18 levels |
| (K) | More than |
+58% ★ |
+20 levels |
| (L) | More than |
+40% |
+22 levels |
| (M) | More than |
+38% |
+24 levels |
| (N) | More than |
+33% |
+26 levels |
| (O) | More than |
+40% |
+28 levels |
| (P) | More than |
+36% |
+30 levels |
An adjustment to the loss enhancement is not necessarily a two-level reduction in the final Total Offense Level in every case. Defense counsel should assess the full guideline calculation, any overlapping specific offense characteristics, and which manual controls.
Where federal fraud cases actually cluster.
The Commission's FY 2024 data reveal where the revised thresholds intersect with real-world sentencing volume. Among 4,947 defendants in the published §2B1.1 loss-category breakdown, the largest category was more than $550,000, with 679 individuals. Five adjacent categories covering losses above $95,000 through $3.5 million accounted for 2,628 individuals—about 53% of the total.
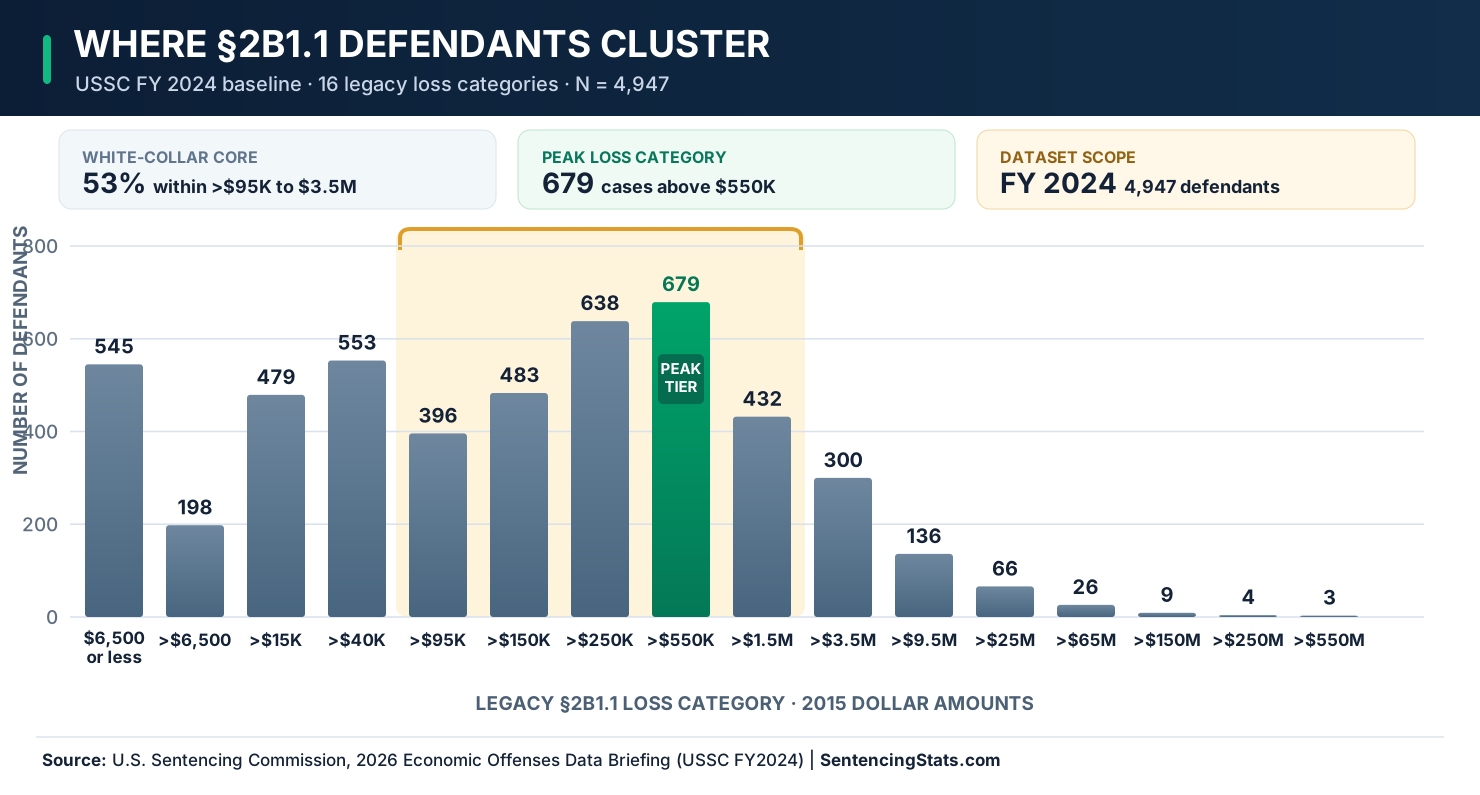
The Commission estimated that the inflationary adjustment alone would change the §2B1.1 loss enhancement for 1,850 defendants (37%) in that FY 2024 cohort. This estimate is a snapshot based on 2024 data, not a live count of 2026 sentencings.
Comparing $1.75 million fraud loss sentencing data before and after Amendment 838.
Consider a hypothetical wire-fraud prosecution involving a $1,750,000 loss and a defendant in Criminal History Category I. Under the prior loss table, that amount triggered a +16 enhancement (Tier I). The November 1, 2026 threshold moves the same loss into +14 (Tier H)—a two-level reduction without changing the loss amount.
The guideline calculation moves from TOL 19 to TOL 17, changing the CHC I advisory range from 30–37 to 24–30 months.
| Guideline component | Prior loss table | 2026 loss table |
|---|---|---|
| Base offense level §2B1.1(a)(1) | +7 | +7 |
| Loss enhancement §2B1.1(b)(1) | +16 | +14 |
| Acceptance of responsibility §3E1.1(a) | −2 | −2 |
| Zero-point adjustment §4C1.1 | −2 | −2 |
| Final total offense level | 19 | 17 |
| CHC I advisory range | 30–37 months | 24–30 months |
To illustrate just how impactful the revised loss thresholds can be, we examine historical sentences from fiscal years 2019–2025 with a lead guideline of §2B1.1, within Criminal History Category I, excluding §5K1.1 sentences and statutory mandatory-minimum cases. We then compare the prior Total Offense Level of 19 with the new Total Offense Level of 17.
Cohort Comparison
| Metric | TOL 19 | TOL 17 |
|---|---|---|
| Sample size | 362 defendants | 434 defendants |
| CHC I advisory range | 30–37 months | 24–30 months |
| Average sentence imposed | 19.0 months | 12.2 months |
| Median sentence imposed | 20.0 months | 12.0 months |
| Interquartile range | 12–30 months | 0–21 months |
| Probation rate | 12.2% | 22.8% |
| Sentenced below guidelines | 71.0% | 75.5% |
| Degree below guideline minimum | 54.8% | 66.0% |
| Sentenced within guidelines | 26.8% | 24.1% |
| Sentenced above guidelines | 2.2% | 0.5% |
Across the two historical cohorts, the median sentence falls from 20 to 12 months, the average sentence declines from 19.0 to 12.2 months, and the share receiving straight probation rises from 12.2% to 22.8%. Below-guideline sentences are common in both groups: 71.0% at TOL 19 and 75.5% at TOL 17.
We can drill down further by comparing two outcome groups: defendants who received non-custodial sentences (straight probation), and a broader group combining non-custodial sentences with sentences of time served. The broader group's share increases from 17.7% at TOL 19 to 29.3% at TOL 17.
Source and methodology: SentencingStats utilizes the SPSS version of the U.S. Sentencing Commission’s datafiles, with records on 313,875 individuals sentenced under the U.S. Sentencing Guidelines in fiscal years 2021–2025. The cohort comparison above queries FY 2019–2025, using CHC I and the stated exclusions, and compares two historical groups at TOL 19 and TOL 17. These are observed cohort outcomes, not predictions for an individual case.
A practical filtering protocol for sentencing comparables.
When extracting historical sentencing data from SentencingStats.com for Presentence Investigation Reports (PSRs) and sentencing memoranda, defense counsel should follow a standardized filtering protocol to present an airtight benchmark cohort to the court:
Lead offense guideline
Start with USSG §2B1.1 for fraud and related economic offenses.
Criminal History Category
Match the defendant's criminal-history category.
Recalibrated Total Offense Level
Use the adjusted level calculated under the new GLAPP Loss Table.
Exclusions and statutory constraints
Exclude statutory mandatory-minimum cases and §5K1.1 cooperators.
Loss-band sensitivity
Apply a filter for the exact loss range and compare it with the broader cohort to determine which is most useful and appropriate.
Enhancements and SOCs
Experiment with aggravating or mitigating role, plea type, and §1028A filters, if applicable. Favor closer comparability without shrinking the set so far that results become unstable.
Strategic Action Plan: Leveraging the Live 2026 Manual in Pending Cases
For defense attorneys handling open economic crime prosecutions or defendants awaiting sentencing right now, the live November 1, 2026 amendments provide three immediate strategic moves:
Audit Pending PSRs Under §1B1.11
Review every open economic crime case where a guilty plea was entered or a PSR was drafted prior to November 1, 2026. Recalculate the loss figure under the 2026 §2B1.1 table to determine if the client falls inside an applicable inflationary reduction window, and file supplemental PSR objections requiring application of the amended loss table.
Renegotiate Pre-November 1 Plea Stipulations
Where a plea agreement signed earlier in 2025 or 2026 stipulates to an offense-level enhancement based on the legacy 2015 loss brackets, reopen discussions with the AUSA to modify the stipulation so it conforms to the live November 1, 2026 guideline text.
Anchor § 3553(a)(6) Disparity Arguments to the New Cohort Median
Once your client drops into a lower Total Offense Level cohort under the 2026 loss table, pair that recalculation with SentencingStats.com empirical data, providing extensive filtering, downward variance rates and degrees, reasons for variance, trend data and plea-type comparison, at the national, circuit and district levels.
Put the new guideline numbers in context.
Move beyond a revised offense level. Explore comparable sentences, judge-specific patterns, plea outcomes, and mitigation framing with empirical sentencing analytics.
Explore SentencingStatsFrequently asked questions about Amendment 838
When did USSC Amendment 838 take effect?
Amendment 838 took effect on November 1, 2026. It raises economic-offense monetary thresholds, including those in the USSG §2B1.1 loss table.
How does Amendment 838 change a fraud loss enhancement?
For a fixed loss amount, the updated loss table either leaves the enhancement unchanged or reduces it by two offense levels. Any additional reduction to the calculated offense level requires a separate guideline adjustment; the court may also vary from the advisory range when imposing sentence.
What happens to a $1.75 million wire-fraud loss?
In the article’s hypothetical, that loss moves from a +16 to a +14 enhancement. With the stated other adjustments, the total offense level moves from 19 to 17, and the CHC I advisory range changes from 30–37 to 24–30 months.
How should counsel select historical sentencing comparables?
Start with the recalculated total offense level and criminal-history category. Apply relevant exclusions and test narrower loss ranges, offense guidelines, role adjustments and other case features while retaining enough cases for useful comparisons.
Primary sources & methodology
- U.S. Sentencing Commission, 2026 Guidelines Manual (effective November 1, 2026), including USSG §§2B1.1, 4C1.1 and Chapter 5, Part A.
- U.S. Sentencing Commission, Amendment 838 (inflation adjustments to monetary thresholds).
- U.S. Sentencing Commission, Amendment 791 (2015) (prior inflation adjustment for the economic-offense loss table).
- USSG §2B1.1(a) (base offense level 6 or 7, depending on the offense of conviction), and §4C1.1 (eligibility for zero-point reduction).
- U.S. Sentencing Commission, 2026 Economic Offenses Public Data Briefing (FY 2024 loss-category distribution and modeled impact of inflation changes).
- USSG §1B1.11 (manual effective at sentencing and ex post facto considerations).
Figures in the case study are hypothetical; empirical comparisons are drawn from distinct historical sentencing cohorts.